This section presents state and territory statistics about incidents of victimisation for a selected range of offences that came to the attention of state and territory police during the period 1 January to 31 December 2016. Note that Assault data are not published for Victoria or Queensland (see Explanatory Notes paragraphs 61–63).
Between 2015 and 2016:
The number of victims of Homicide and related offences increased nationally by 9%, from 416 to 452 victims. The number of Murder victims decreased (down 4% or nine victims), while the number of Attempted Murder victims increased by 26% (41 victims). Queensland contributed the largest numerical movements for victims of Attempted murder (up 59% or 27 victims).
The largest increases in the number of victims of Assault occurred in Western Australia (up 2,901 victims or 10%) followed by the Australian Capital Territory (386 victims or 20%), while the largest decrease occurred in South Australia (292 victims or 2%).
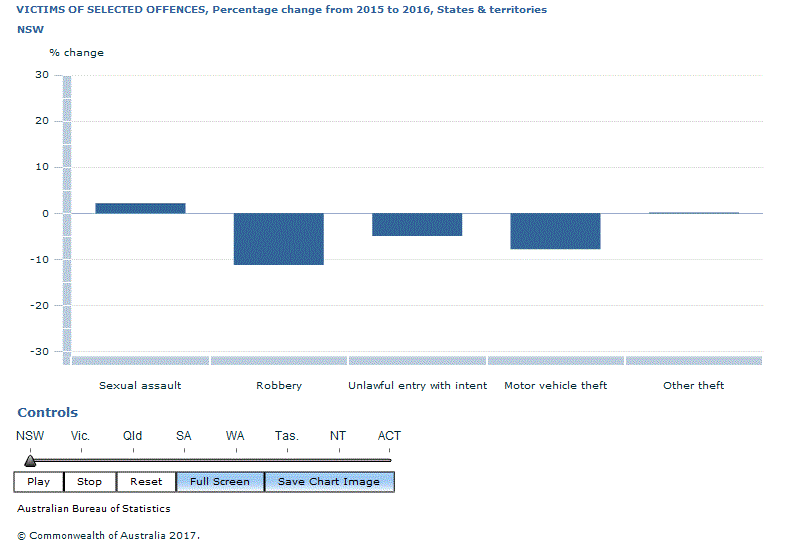
There was an increase in the number of Sexual assault victims in all states and territories except South Australia (down 4% or 69 victims) and the Northern Territory (down 6% or 23 victims). The largest increase in the number of Sexual assault victims occurred in Victoria, increasing by 14% (or 662 victims) to the largest number of victims since the beginning of the time series in 2010.
The national increase in the number of victims of Robbery (up 5% from 8,968 to 9,403 victims) was driven by increases in Victoria (up 22%, or 541 victims) and Queensland (up 17% or 235 victims).
The largest increase in the number of victims of unlawful entry with intent occurred in Victoria (up 10% or 4,839 victims) – the highest number of victims since the time series started in 2010,while the largest decrease occurred in New South Wales (down 5% or 2,110 victims) – the lowest for the time series.
The national increase in Motor vehicle theft (up 9% from 51,525 to 56,086 victims) was driven by increases in three jurisdictions: Victoria (up 25% or 3,855 victims – the highest for the time series); Queensland (up 19% or 1,596 victims); and South Australia (up 10% or 332 victims). While the remaining jurisdictions decreased, the largest occurred in New South Wales (down 8%, or 1,019 victims – its lowest levels for the time series).
The number of victims of Other theft in Victoria, Queensland and South Australia reached their highest levels for the time series (up 16%, 12% and 7%, respectively), contributing to the 5% increase nationally from 509,649 to 537,283 victims.
Source(s): Recorded Crime - Victims
Document Selection
These documents will be presented in a new window.
 Print Page
 Print All